Mastering Database Monitoring: Unlocking Key Insights into Performance.
Introduction
Database monitoring is an essential aspect of database management that ensures optimal performance, reliability, and security of data. It involves collecting, analyzing, and reporting on various metrics and indicators that reflect the health and activity of a database system. By monitoring databases, database administrators (DBAs) and developers can gain valuable insights into the performance of their applications, identify and troubleshoot issues, and optimize their database operations.
The role of performance in database management is crucial, as it affects the user experience, the efficiency of business processes, and the profitability of organizations. Poor performance can result in slow response times, high error rates, low throughput, and data loss. These can have negative consequences such as customer dissatisfaction, reduced productivity, increased costs, and reputational damage. Therefore, it is imperative to monitor databases regularly and proactively to ensure high performance and availability.
The Basics of Database Monitoring
What is Database Monitoring?
Database monitoring is the process of observing and measuring the behavior and performance of a database system. It involves collecting data from various sources, such as logs, queries, transactions, events, resources, and metrics. The data is then processed and analyzed to generate reports and dashboards that provide information on the status and trends of the database system. The purpose of database monitoring is to help DBAs and developers understand how their databases are functioning, detect and diagnose problems, and optimize their database performance.
The Components of Database Monitoring
Database monitoring consists of two main components: metrics and tools.
- Metrics and KPIs
Metrics are quantitative measurements that indicate the performance and health of a database system. They can be categorized into different types, such as availability, utilization, throughput, response time, error rate, etc. Metrics can be further divided into key performance indicators (KPIs), which are the most important metrics that reflect the goals and objectives of the database system. For example, some common KPIs for database performance are:
- Availability: The percentage of time that the database system is operational and accessible.
- Utilization: The amount of resources (such as CPU, memory, disk space, etc.) that the database system consumes.
- Throughput: The number of transactions or queries that the database system can process per unit of time.
- Response Time: The amount of time that the database system takes to execute a transaction or query.
- Error Rate: The percentage of transactions or queries that fail or return incorrect results.
- Tools and Software
Tools are software applications or programs that facilitate the collection, analysis, and presentation of database monitoring data. They can be classified into different types, such as:
- Agents: Software components that run on the database server or client and collect data from various sources.
- Probes: Software components that run on a separate server or device and send requests to the database system to collect data.
- Log Analyzers: Software applications that parse and analyze log files generated by the database system.
- Query Analyzers: Software applications that capture and analyze queries executed by the database system.
- Performance Analyzers: Software applications that process and visualize performance metrics collected by agents or probes.
- Alerting Systems: Software applications that send notifications to DBAs or developers when certain conditions or thresholds are met or exceeded.
Benefits of Proactive Monitoring
Proactive monitoring is a proactive approach to database monitoring that involves setting up alerts and notifications based on predefined thresholds or rules. It enables DBAs and developers to identify and resolve issues before they escalate or affect users or business operations. Some of the benefits of proactive monitoring are:
- Improved performance: By detecting and resolving issues early, proactive monitoring can help improve the performance and availability of the database system.
- Reduced downtime: By preventing or minimizing failures or outages, proactive monitoring can help reduce downtime and data loss.
- Enhanced security: By identifying and mitigating potential threats or vulnerabilities, proactive monitoring can help enhance the security and integrity of the data.
- Increased efficiency: By automating data collection and analysis, proactive monitoring can help reduce manual work and human errors.
- Better decision-making: By providing timely and accurate information on the database system’s status and trends, proactive monitoring can help support better decision-making.
Key Performance Metrics to Monitor
There are many metrics that can be monitored for a database system, but some of them are more critical than others. Here are some of the key performance metrics that DBAs and developers should monitor:
Response Time
Response time is one of the most important metrics for measuring database performance. It indicates how fast the database system can execute a transaction or query. Response time can be affected by various factors, such as:
- Query complexity: The number and type of operations involved in a query.
- Data size: The amount of data involved in a query.
- Indexing: The presence or absence of indexes on the tables or columns involved in a query.
- Concurrency: The number of concurrent transactions or queries running on the database system.
- Resource contention: The competition for resources (such as CPU, memory, disk, network, etc.) among transactions or queries.
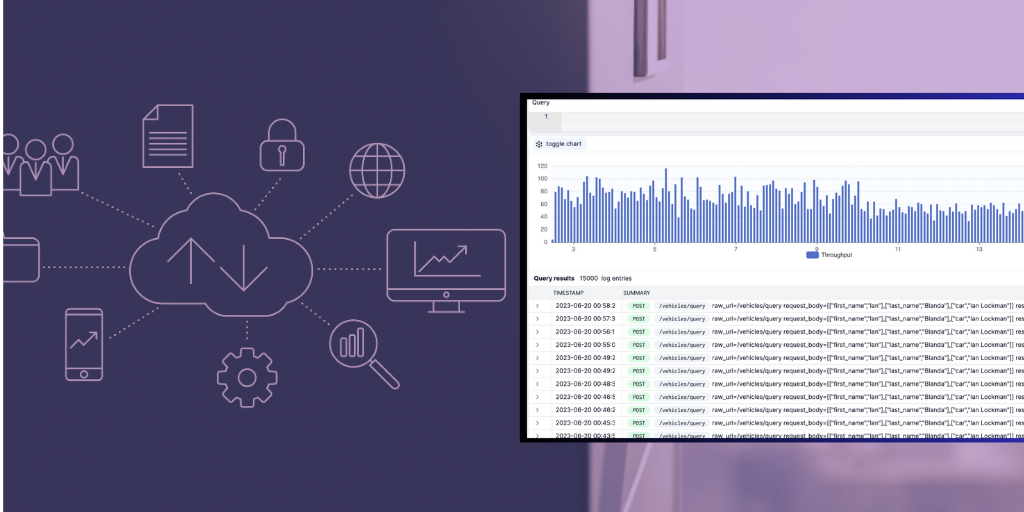
To monitor response time, DBAs and developers can use tools such as query analyzers or performance analyzers that can capture and display the execution time of each query. They can also use tools such as alerting systems that can notify them when the response time exceeds a certain threshold.
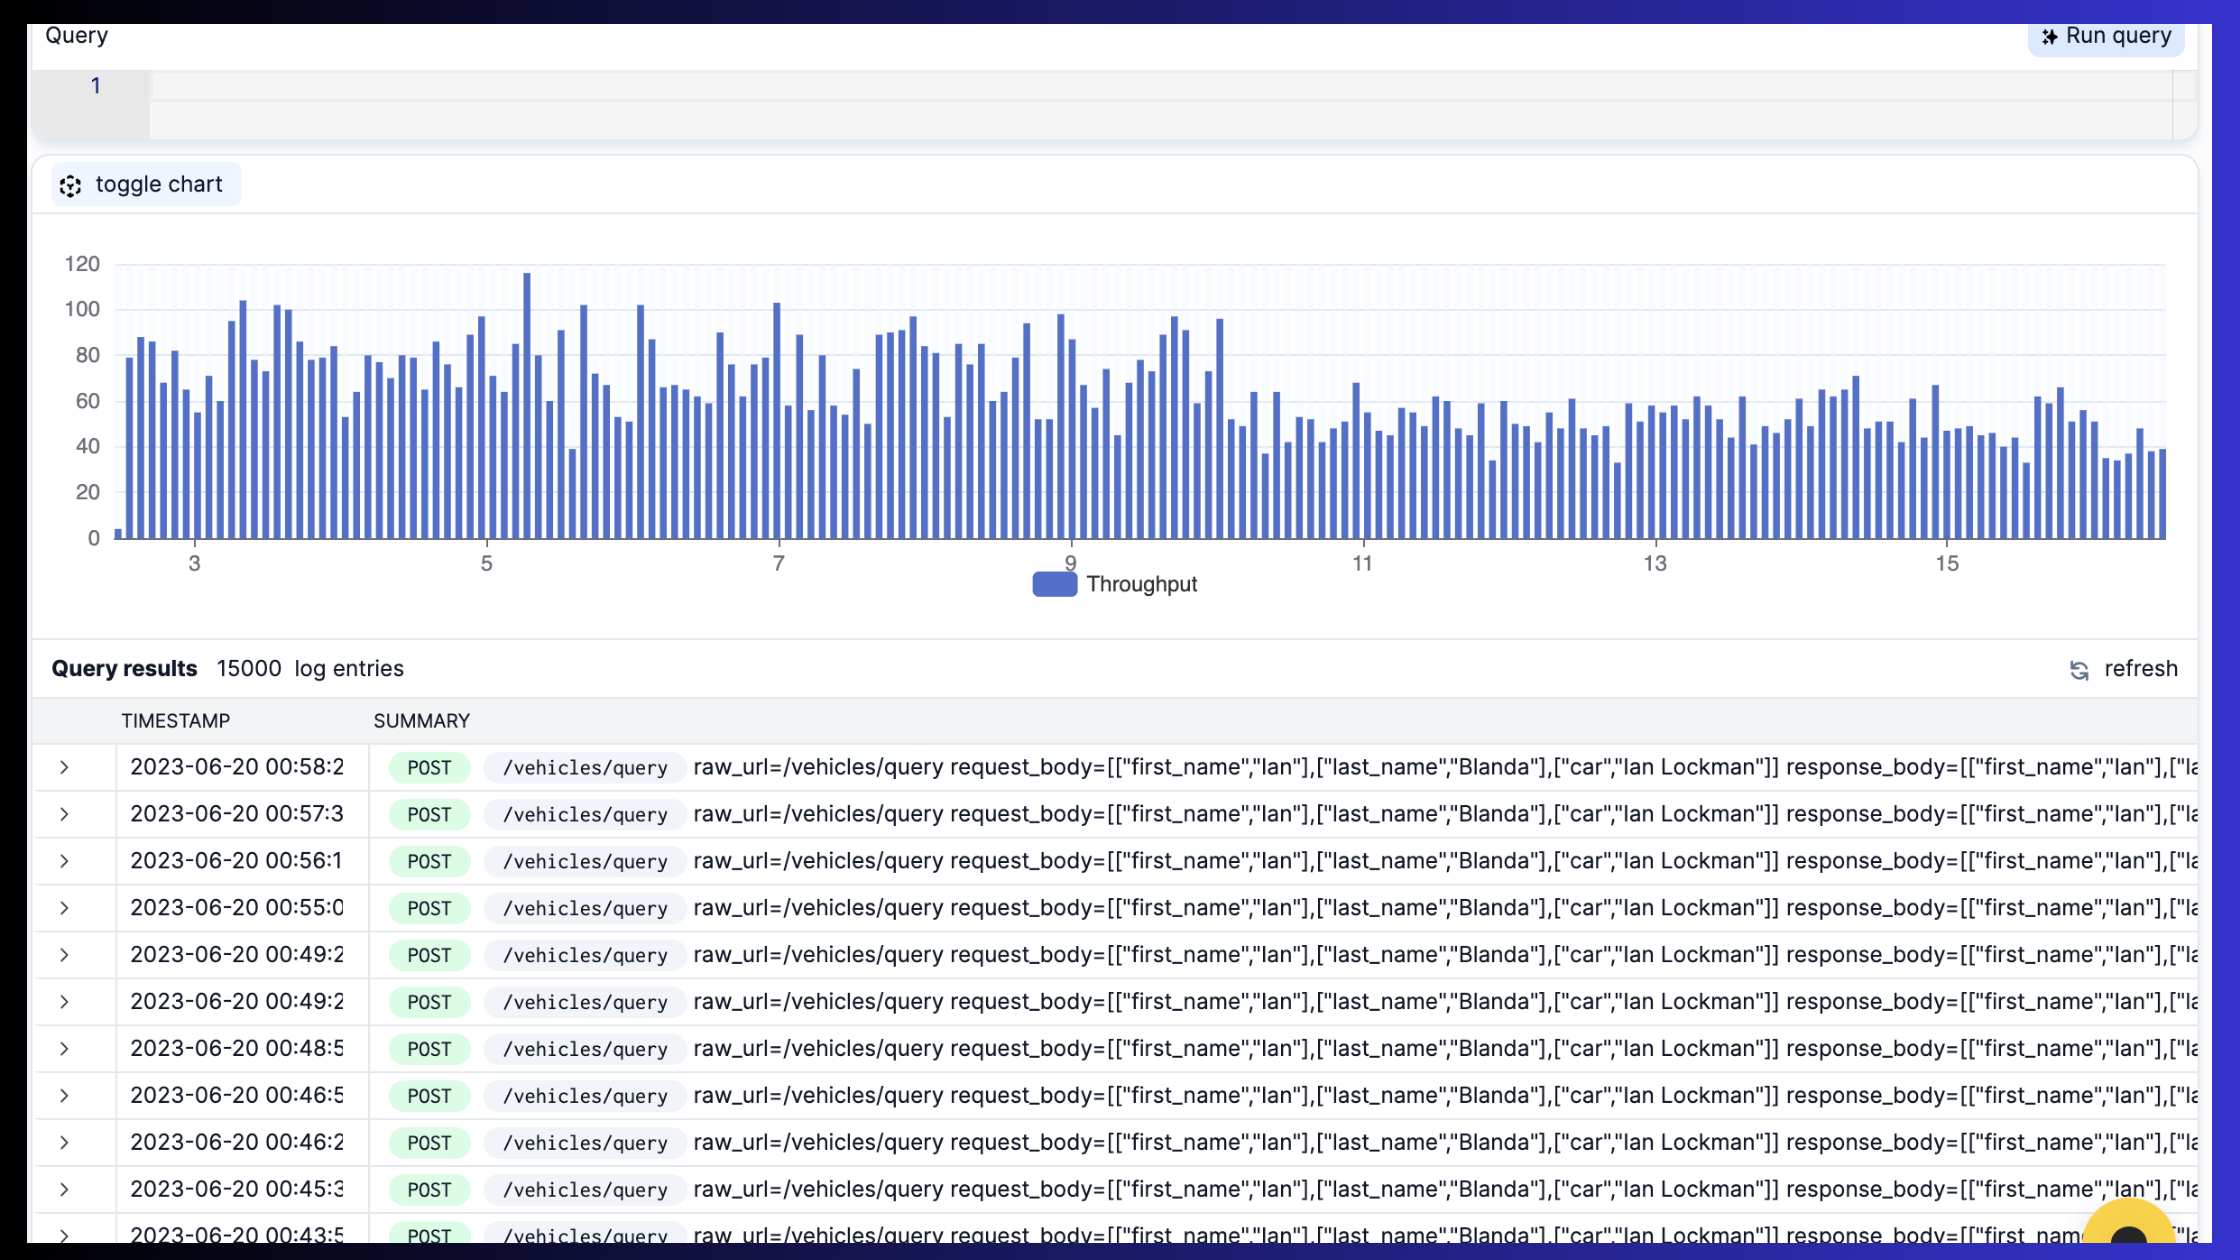 Image source: APIToolkit Query Analyzer
Throughput
Throughput is another important metric for measuring database performance. It indicates how many transactions or queries the database system can process per unit of time. Throughput can be influenced by factors such as:
- Query optimization: The efficiency and effectiveness of the query execution plan generated by the database system.
- Data distribution: The location and partitioning of the data across the database system.
- Load balancing: The distribution of the workload across the database system.
- Scalability: The ability of the database system to handle increasing or decreasing workload.
To monitor throughput, DBAs and developers can use tools such as performance analyzers that can collect and display the number of transactions or queries per second or per minute. They can also use tools such as alerting systems that can notify them when the throughput falls below a certain threshold.
Error Rate
Error rate is another important metric for measuring database performance. It indicates how many transactions or queries fail or return incorrect results. Error rate can be caused by factors such as:
- Data quality: The accuracy and completeness of the data stored in the database system.
- Data integrity: The consistency and validity of the data stored in the database system.
- Data security: The protection and authorization of the data stored in the database system.
- Data availability: The accessibility and recoverability of the data stored in the database system.
To monitor error rate, DBAs and developers can use tools such as log analyzers or query analyzers that can capture and display the number and type of errors encountered by the database system. They can also use tools such as alerting systems that can notify them when the error rate exceeds a certain threshold.
- Tools and Software for Database Monitoring
There are many tools and software available for database monitoring, but some are more popular. Here are some of the widely-used database monitoring tools:
- APIToolkit Monitoring: A cloud-based API management tool that provides end-to-end visibility into database performance, including metrics, traces, logs, events, etc. It supports various database platforms, such as MySQL, PostgreSQL, MongoDB, Redis, etc.
- SolarWinds Database Performance Analyzer (DPA): A comprehensive tool that provides real-time and historical analysis of database performance, including response time, throughput, resource utilization, wait times, blocking, deadlocks, etc. It supports various database platforms, such as Oracle, SQL Server, MySQL, PostgreSQL, etc.
- Quest Foglight for Databases: A holistic tool that provides cross-platform monitoring and optimization of database performance, including availability, workload, resource consumption, SQL tuning, etc. It supports various database platforms, such as Oracle, SQL Server, MySQL, PostgreSQL, etc.
- Redgate SQL Monitor: A specialized tool that provides in-depth monitoring and alerting of SQL Server performance, including metrics, queries, waits, locks, errors, etc. It also provides recommendations and best practices for improving SQL Server performance.
Read: Key Benefits of API Integration for Developers (with Statistics)
Read: 10 Must-Know API Trends in 2023
Read: API Monitoring and Documentation: the Truth You Must Know
Best Practices for Effective Database Monitoring
Establish a Monitoring Strategy
Before you start monitoring your databases, you need to have a clear vision of what you want to achieve and how you will measure it. A monitoring strategy can help you define your goals and objectives, identify your critical databases and workloads, and prioritize your monitoring efforts.
Some of the questions you should ask yourself when developing a monitoring strategy are:
- What are the business goals and objectives of your database systems?
- What are the key performance indicators (KPIs) that reflect those goals and objectives?
- What are the baseline values and expected ranges for those KPIs?
- What are the critical databases and workloads that support your business processes?
- How often do you need to monitor those databases and workloads?
- What are the tools and methods you will use to monitor them?
By answering these questions, you can establish a clear and consistent monitoring strategy that aligns with your business needs and expectations.
Set Up Alerts and Notifications
Once you have a monitoring strategy in place, you need to set up alerts and notifications that will inform you of any issues or anomalies in your database systems. Alerts are triggered when a certain condition or threshold is met or exceeded, such as high CPU usage, low disk space, slow query response time, etc. Notifications are the messages or actions that are sent or executed when an alert is triggered, such as sending an email, logging an event, executing a script, etc.
Alerts and notifications can help you detect and respond to issues quickly and efficiently. However, they can also become overwhelming and ineffective if they are not configured properly. To avoid alert fatigue and ensure timely notifications, you should follow these best practices:
- Define alert thresholds based on your baseline values and expected ranges for your KPIs. Avoid setting thresholds too high or too low, as they may result in false positives or negatives.
- Use different levels of severity for your alerts, such as critical, warning, or informational. This can help you prioritize your response and action based on the urgency and impact of the issue.
- Customize your notifications based on the recipient, channel, frequency, and content. For example, you may want to send critical alerts to multiple recipients via email and SMS immediately, while sending informational alerts to a single recipient via email once a day.
- Review and update your alerts and notifications regularly. You may need to adjust them based on changes in your database systems or business requirements.
Analyzing and Acting on Data
The final step in effective database monitoring is analyzing and acting on the data you collect. Monitoring data can provide you with valuable insights into how your database systems are performing, what are the root causes of issues, what are the trends and patterns over time, what are the areas for improvement, etc.
However, analyzing data can be challenging if you have too much or too little data, if the data is not organized or visualized properly, or if the data is not actionable. To overcome these challenges, you should follow these best practices:
- Use dashboards and reports to organize and visualize your data. Dashboards and reports can help you present your data in a clear and concise way that highlights the most important information. You can use different types of charts, graphs, tables, etc., to display your data according to its nature and purpose.
- Use filters and drill-downs to focus on specific aspects of your data. Filters and drill-downs can help you narrow down your data to a specific database, workload, time period, etc., that you want to analyze in more detail. This can help you identify patterns or anomalies that may otherwise be overlooked.
- Use correlation analysis to find relationships between different metrics or events. Correlation analysis can help you determine how different factors affect each other in your database systems. For example, you can use correlation analysis to find out how CPU usage affects query response time or how disk I/O affects throughput.
- Use root cause analysis to identify the source of issues. Root cause analysis can help you trace back the issue from its symptoms to its origin. For example, if you notice a spike in query response time, you can use root cause analysis to find out what query caused it, what table or index was involved, what was the execution plan, etc.
- Use recommendations and best practices to implement improvements based on your insights. Recommendations and best practices can help you apply the knowledge you gain from your data analysis to improve your database performance, availability, and security. For example, based on your data analysis, you may want to optimize your queries, indexes, or configuration settings, or upgrade your hardware or software.
Conclusion
Database monitoring is a crucial process that can help you unlock key insights into your database performance. By following the best practices discussed in this article, you can establish a monitoring strategy, set up alerts and notifications, analyze and act on data, and implement improvements based on your insights. This can then help you ensure the optimal performance, availability, and security of your APIs and databases and support your business goals and objectives.
Best API Monitoring and Observability Tools in 2023
10 Must-Know API Trends in 2023
Ultimate Guide to API Testing Automation
Web API Performance Best Practices - the Ultimate Guide