Endpoints Page
In this guide, you will learn how to effectively navigate through the Endpoints page on the APItoolkit dashboard and maximize all the powerful features accessible in it.
On this page, you will find all the endpoints tracked from your API. You can filter the list based on the host (e.g., list all endpoints from your localhost, staging, or production environment), search for specific endpoints, and sort based on the first/last time the endpoint was seen or the number of events associated with the endpoint.
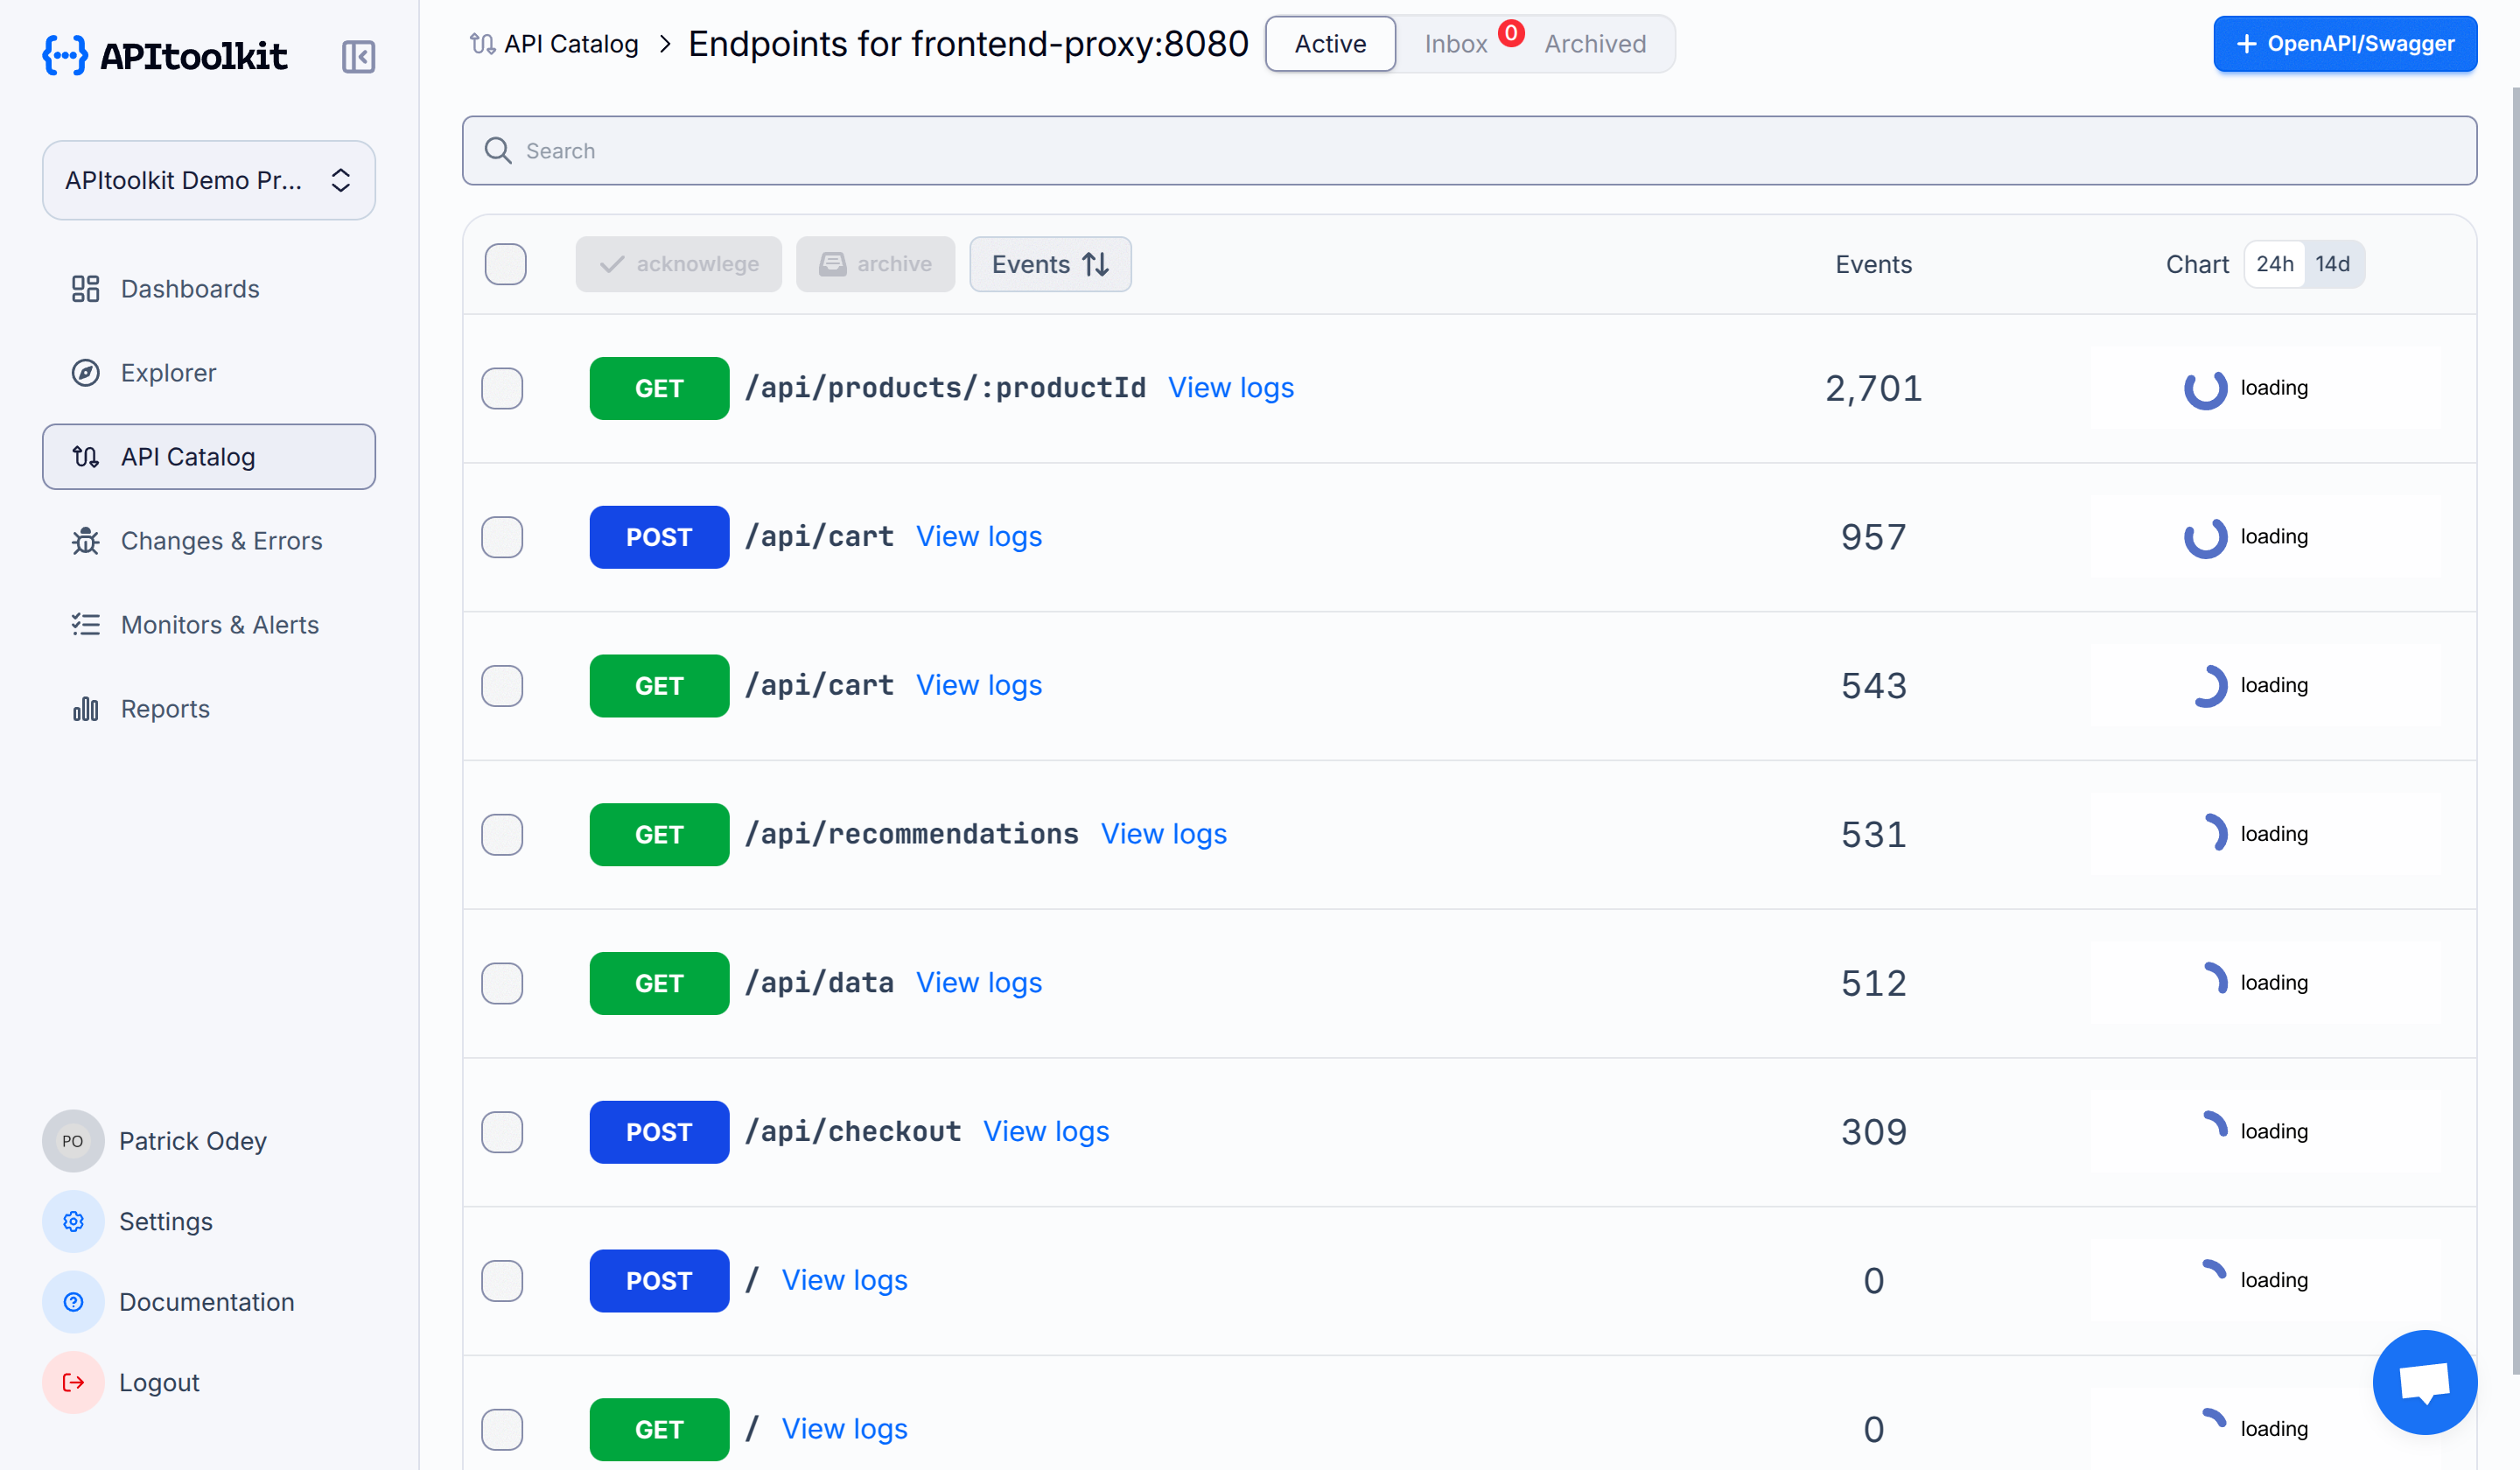
All endpoints are organized based on the following categories:
- Active: All verified and acknowledged endpoints.
- Inbox: All newly detected endpoints that require your attention.
- Archived: All archived endpoints.
When you acknowledge an endpoint or anomaly, APItoolkit understands the shape of the endpoints on your API and uses that information for future anomaly detections. As a side effect, we then use that to trigger the OpenAPI spec generation feature we offer and send you daily/weekly reports. Hence, you should acknowledge all important endpoints you want us to monitor.
You can also click on any displayed endpoint to explore them in more detail. Doing this will redirect you to a new page with similar data visualization of the requests on the Dashboard page. On this new page, you can access three tabs (Overview, API Docs, and Shapes) described below.
Overview
On this tab, the page is split into two parts, namely: Ongoing Anomalies and Monitors and Endpoint Stats as described in the sections below.
Ongoing Anomalies and Monitors
This section displays a quick summary of all ongoing anomalies detected from this endpoint, including the endpoints they were detected on, and the new, updated, or deleted fields detected.
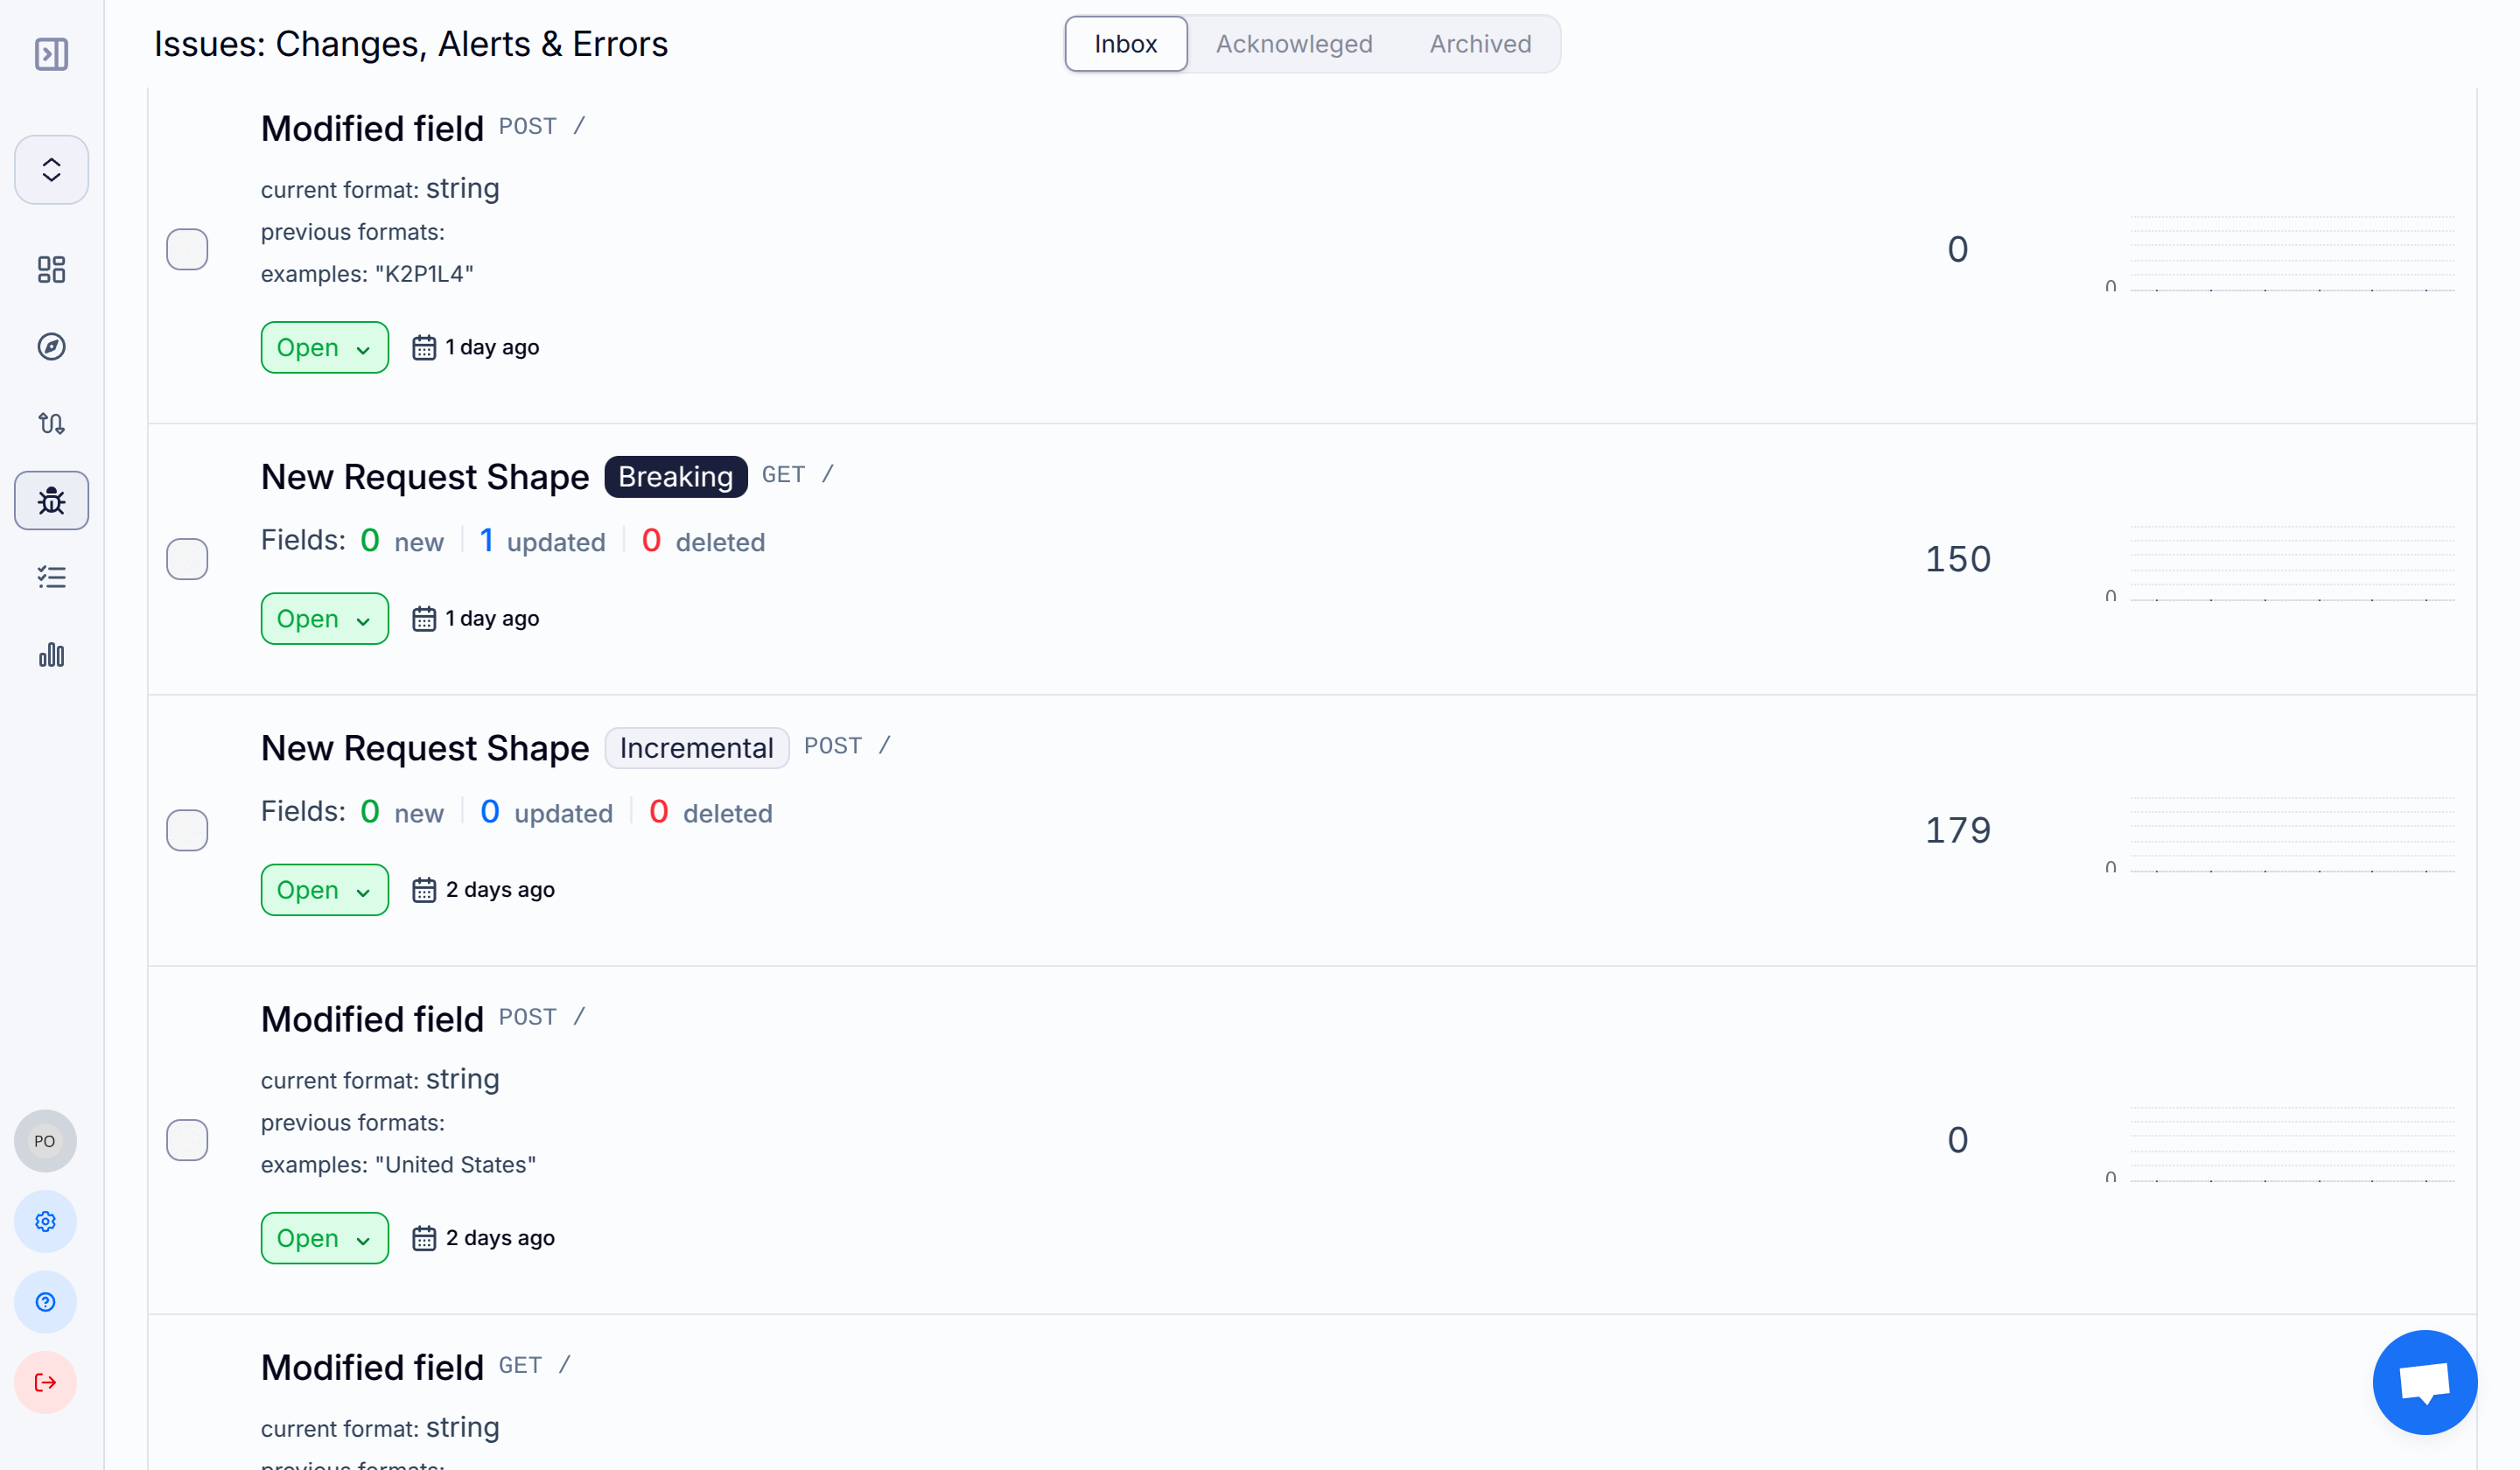
An anomaly is any user activity (requests) on your API that is significantly different from previously tracked activities. This might surface as increased response times, error rates, or downtimes, and can be caused by a variety of conditions such as API changes, server issues, network issues, or security threats.
Endpoint Stats
This section displays some data analysis and visualization from all the requests tracked from this particular endpoint. This section includes the following parameters described below.
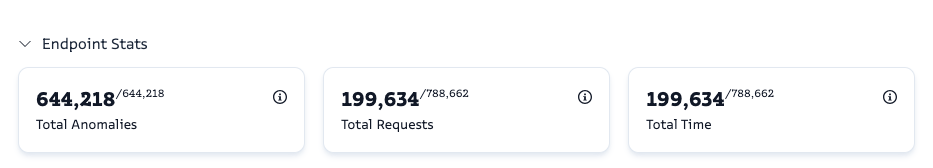
Data Counts
- Total Anomalies: Total number of anomalies for this endpoint this week vs the total for the entire project.
- Total Requests: Total number of requests for this endpoint this week vs the total for the entire project.
- Total Time: Total time on this endpoint this week vs the total for the entire project.
Graphs
- Requests by Status Code: HTTP status code distribution for all requests.
- Latency Percentiles: Response time distribution at the 50th, 75th, and 90th percentiles.
- Errors: Requests with error status responses grouped by status code.
- Requests by Endpoint: All requests grouped by endpoint.
- Request Latency Distribution: Summary of the response time distribution.
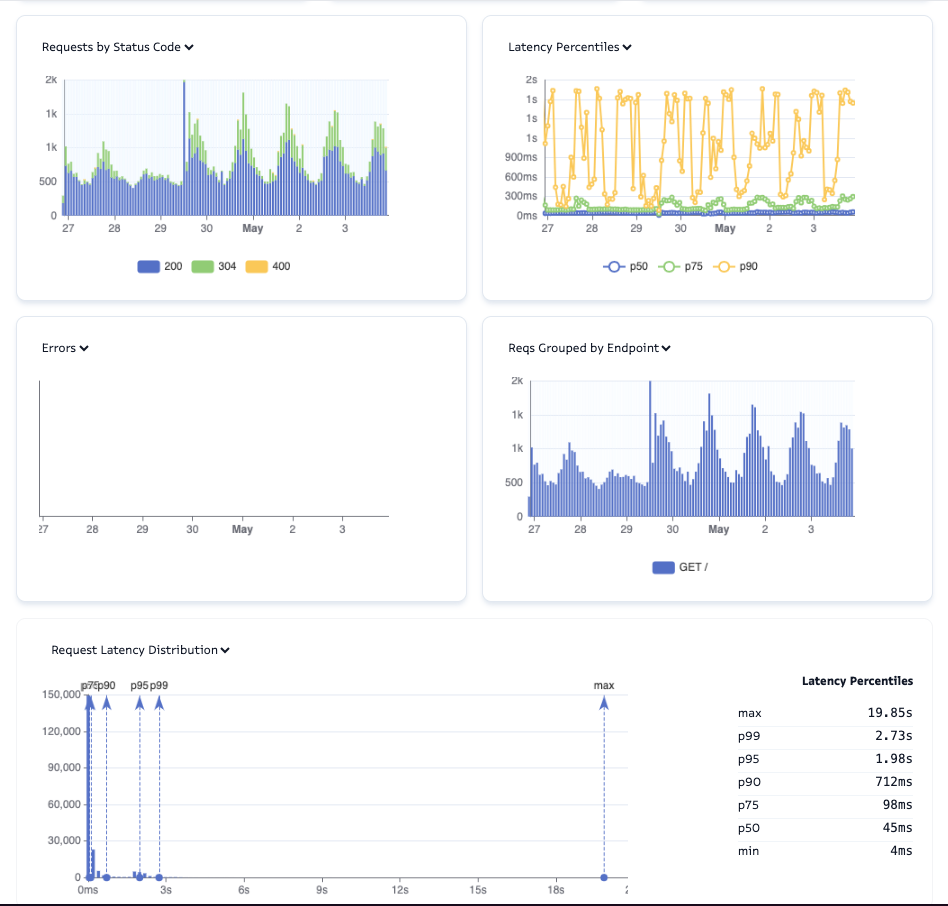
Latency is the amount of time it takes for a packet of data to travel from one place (source) to another (destination).
A percentile is a statistical term that indicates the value below which a specific percentage of data points fall in comparison to the remainder of the data. For example, a value at the 75th percentile indicates that 75% of the data points are below that value and 25% are above it. Percentiles are commonly used to analyze the distribution of a dataset and to identify outliers or anomalies. Common percentiles include: 25th percentile (Q1), 50th percentile (median or Q2), 75th percentile (Q3), 90th percentile, 95th percentile, and 99th percentile.
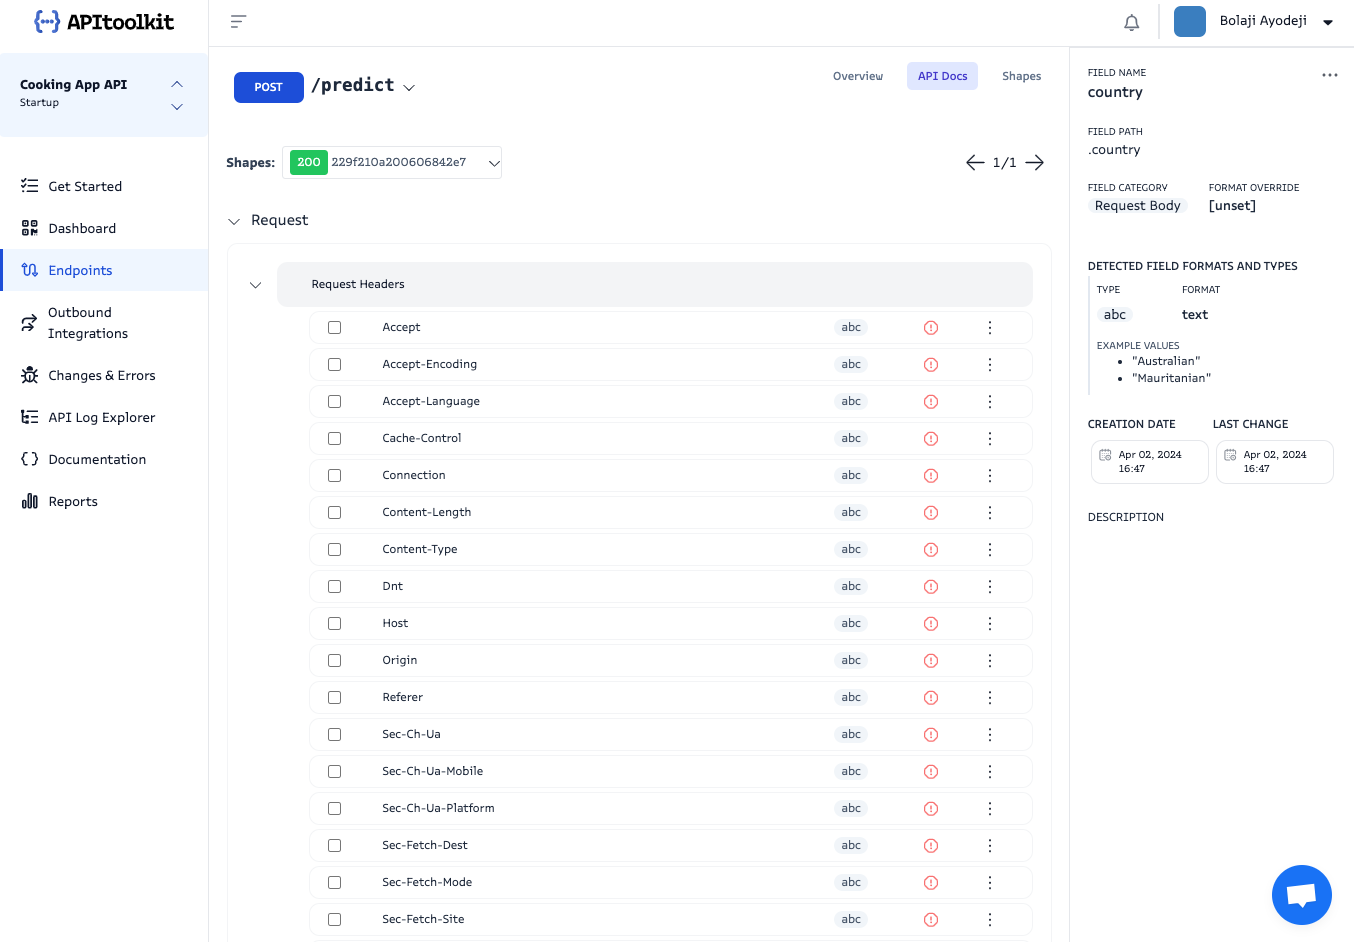
API Docs
On this tab, you get a summary of the shape of your API (Request and Response) including all Headers, Query Params, Body fields, etc. detected. You can click on any of the fields displayed to view more details about it displayed on the right sidebar.
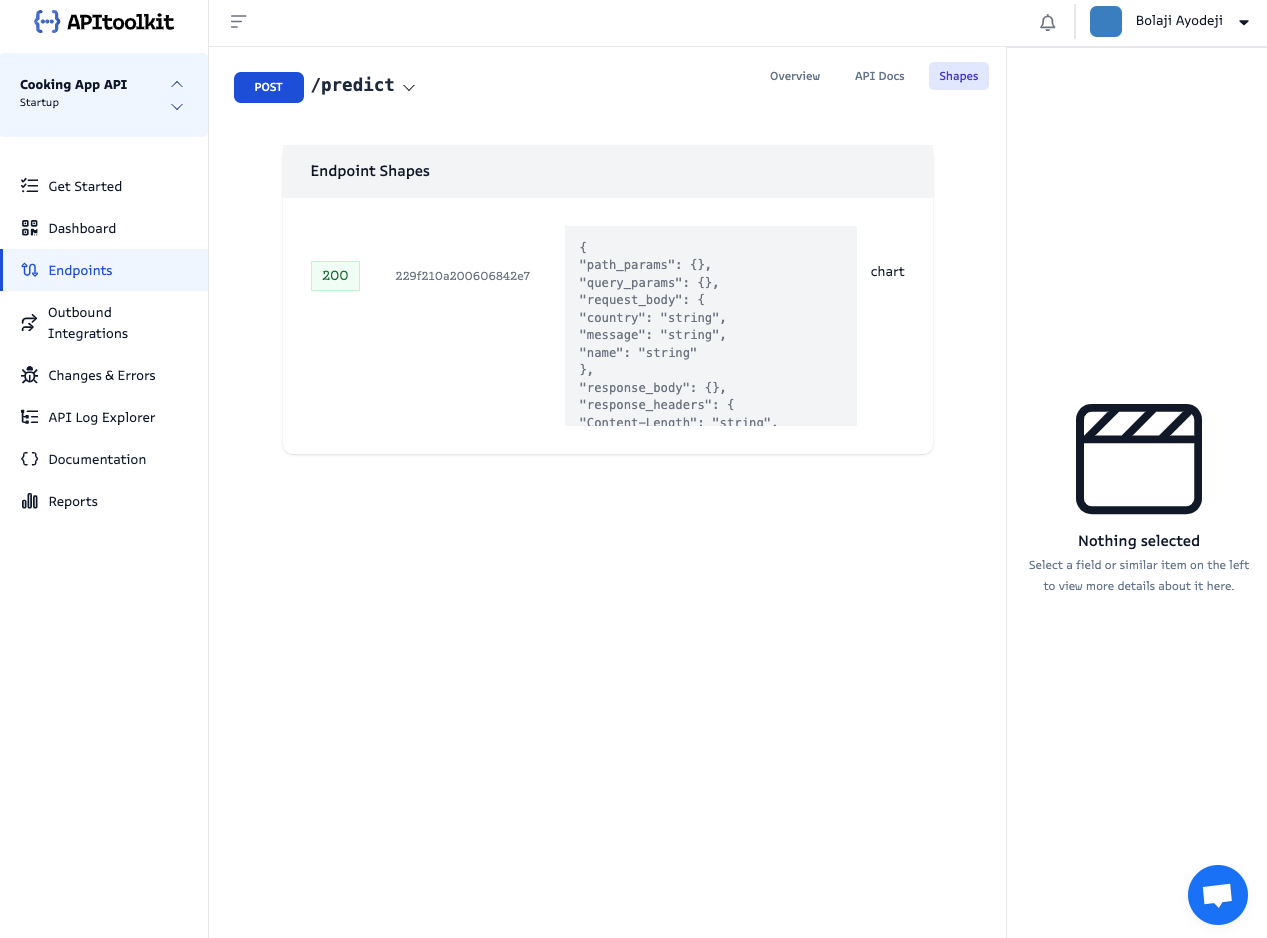
Shapes
On this tab, you get a list of all the shapes of your API detected from different request types. When you click on any shape, it takes you to the API Docs tab where you can preview all the data of the shape as described earlier.
Next: API Log Explorer Page