API Log Explorer Page
In this guide, you will learn how to effectively navigate through the API Log Explorer page on the APItoolkit dashboard and maximize all the powerful features accessible in it.
On this page, you will find a list of all the requests tracked from your API including all the associated fields and parameters and a throughput graph. You can filter the data using the toggle at the top-left section of the page (the default is Last 24 Hours), toggle any log request to view all the associated details, or further click on a Trace to view even more request and response details.
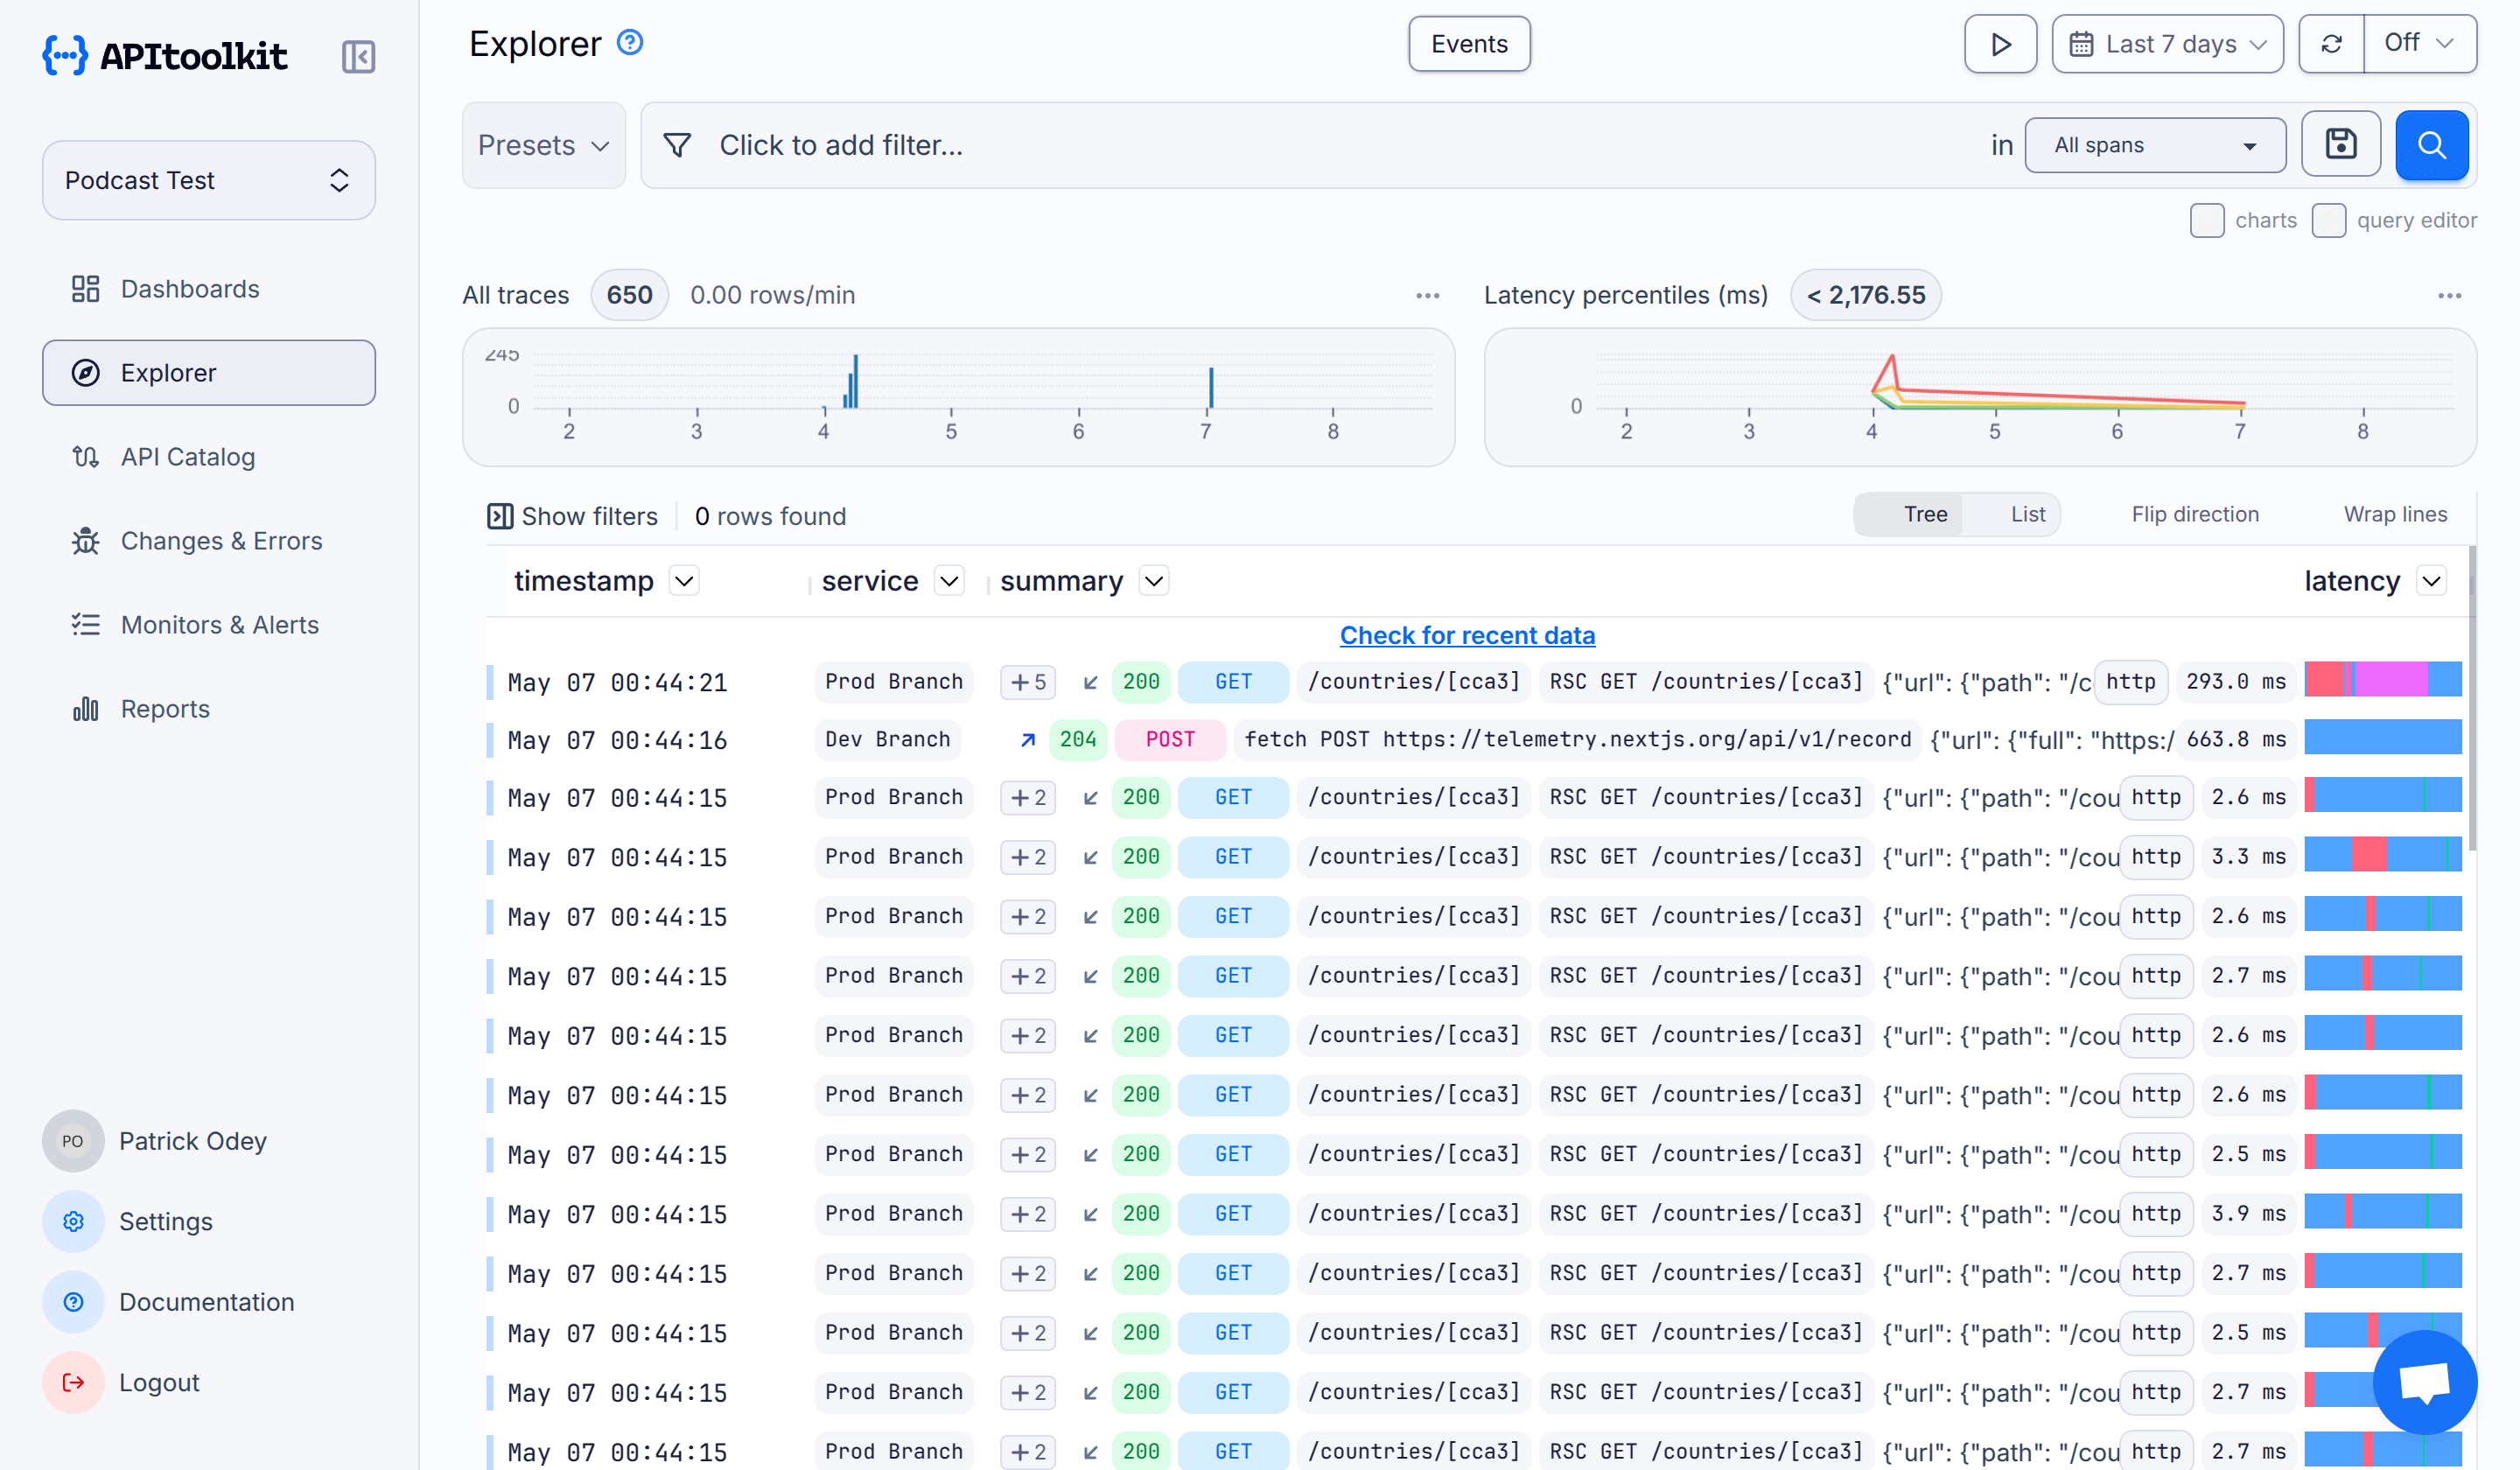
Throughput refers to the rate at which an amount of data is transmitted over a given period of time.
Query Results
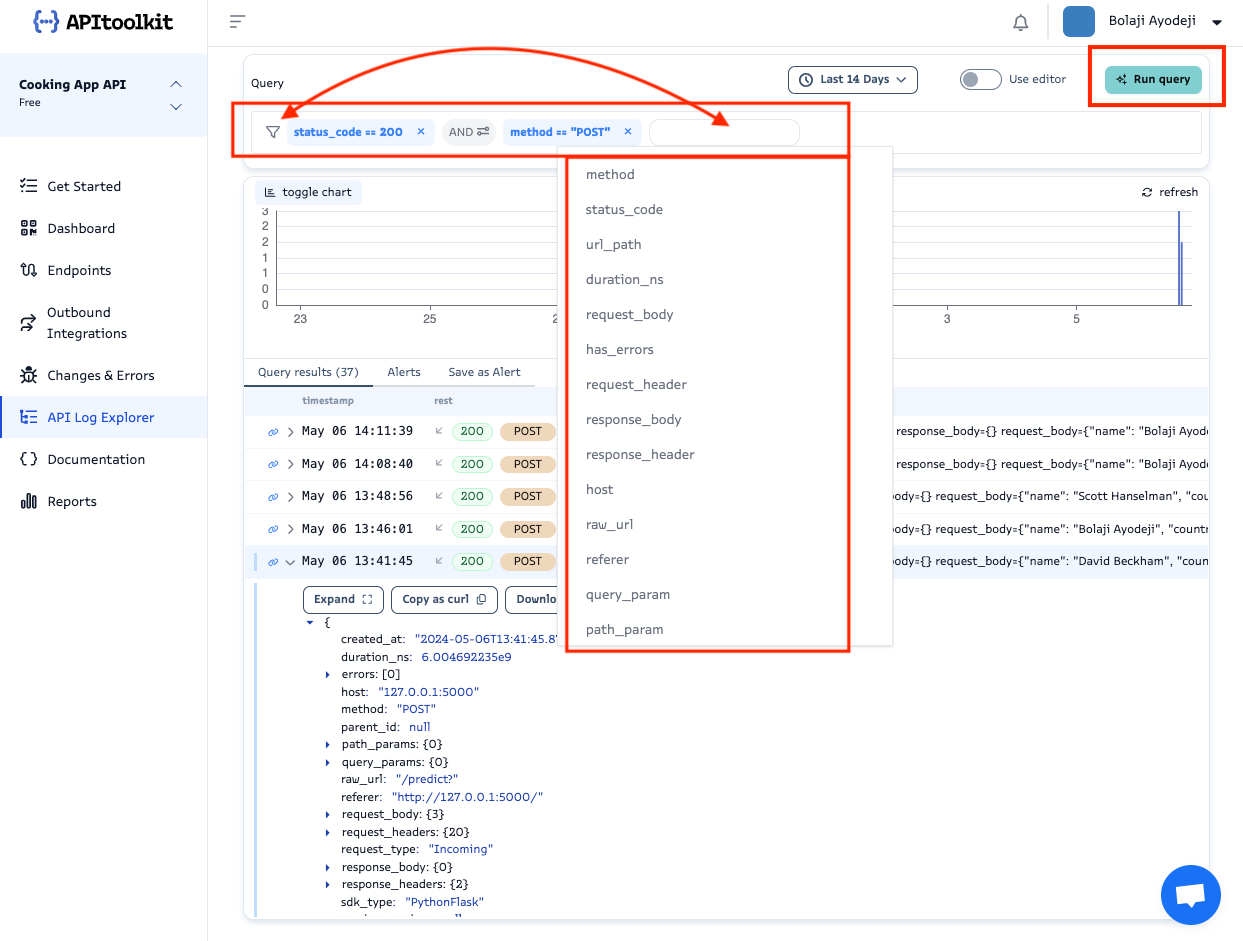
You can filter the data displayed on the API Log Explorer using one or more fields from the request (status_code, host, request_body, method, request_type, etc.) using the following comparison symbols:
| Symbol | Description |
|---|---|
| == | Equals to another value. |
| != | Not equal to another value. |
| > | Greater than another value. |
| < | Less than another value. |
| >= | Greater than or equal to another value. |
| <= | Less than or equal to another value. |
There are two query filtering options, the manual selector mode and the editor mode.
You can manually add filters by selecting the fields and sub-fields you want and clicking the Run Query button as seen in the image below.
Alternatively, you can toggle the Use editor button, use the text editor to write the query as text and click the Run Query button as seen in the image below.
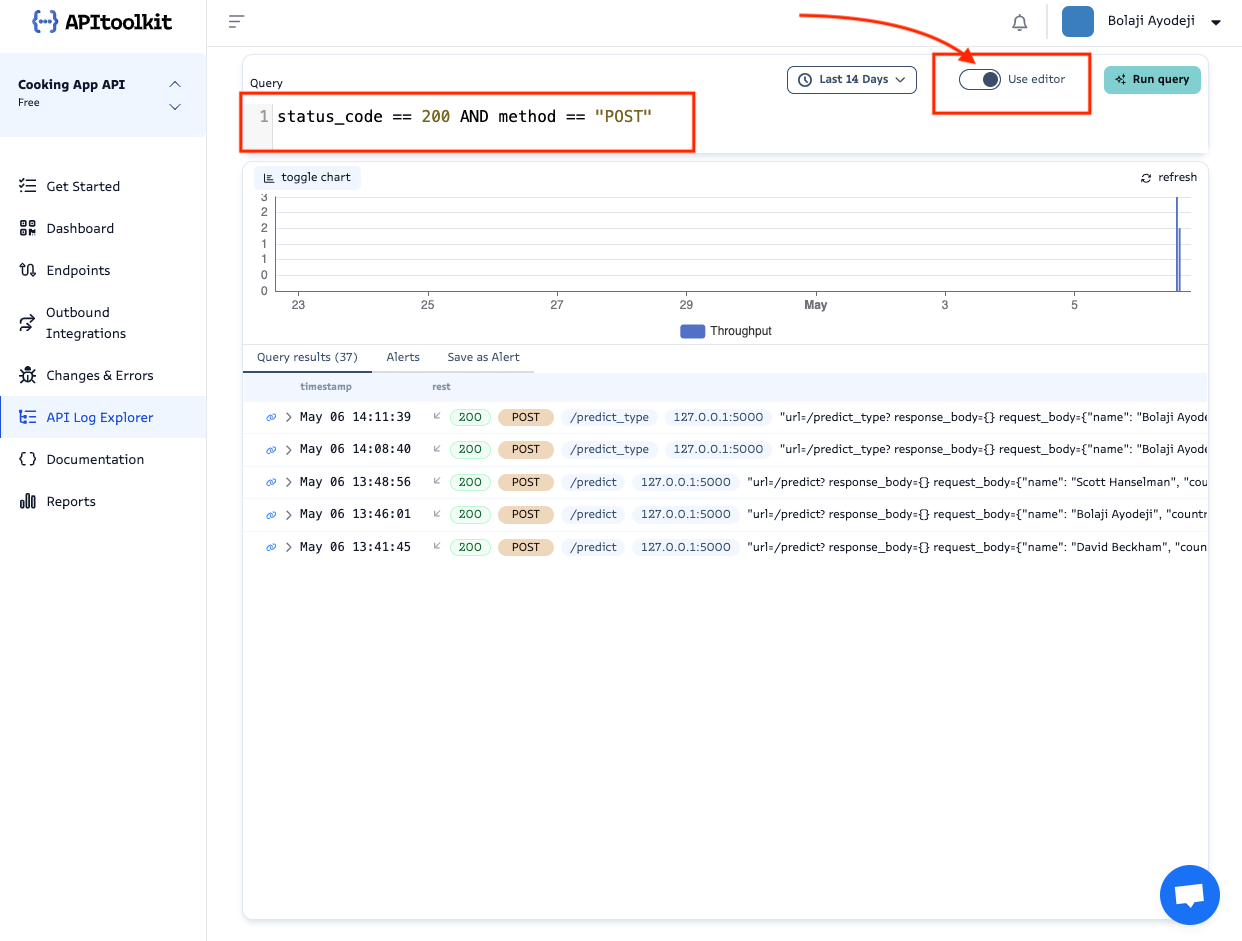
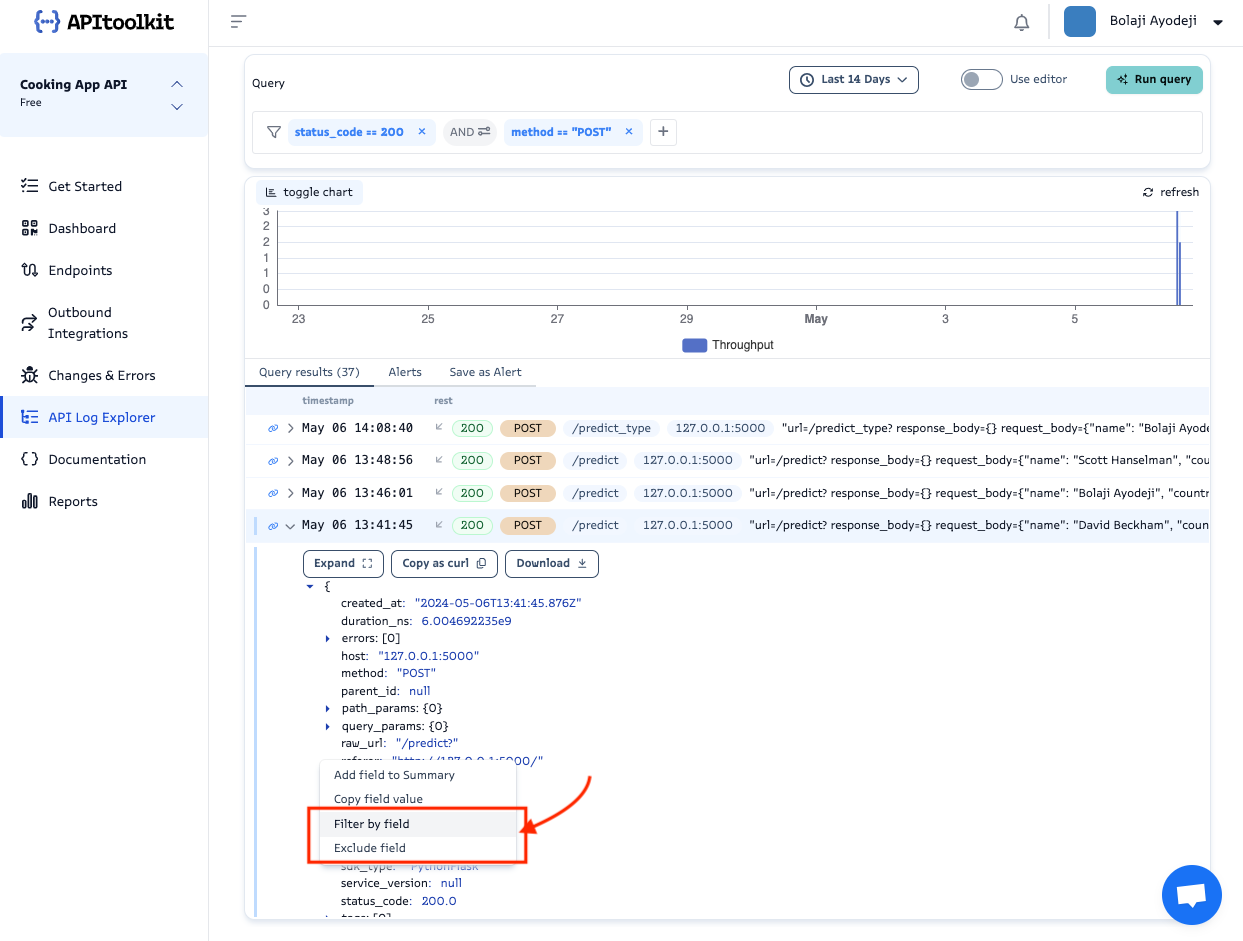
If you toggle a request log, you can also manually select a field, click on it, and click the Filter by field or Exclude by field options to automatically add that field to the list of queries and run the query immediately.
Alerts
You can create an alert and get notified via email or a Slack channel (if already configured) when some requests cross a defined throughput threshold. To achieve this, apply your desired filters first, click on the Save as Alert tab, input the alert/warning threshold values, define the alert message, and select the notification channels where the alert will be sent.
<!– You can also use template tags in the subject like so: Error in {/{alert.tags}} –>
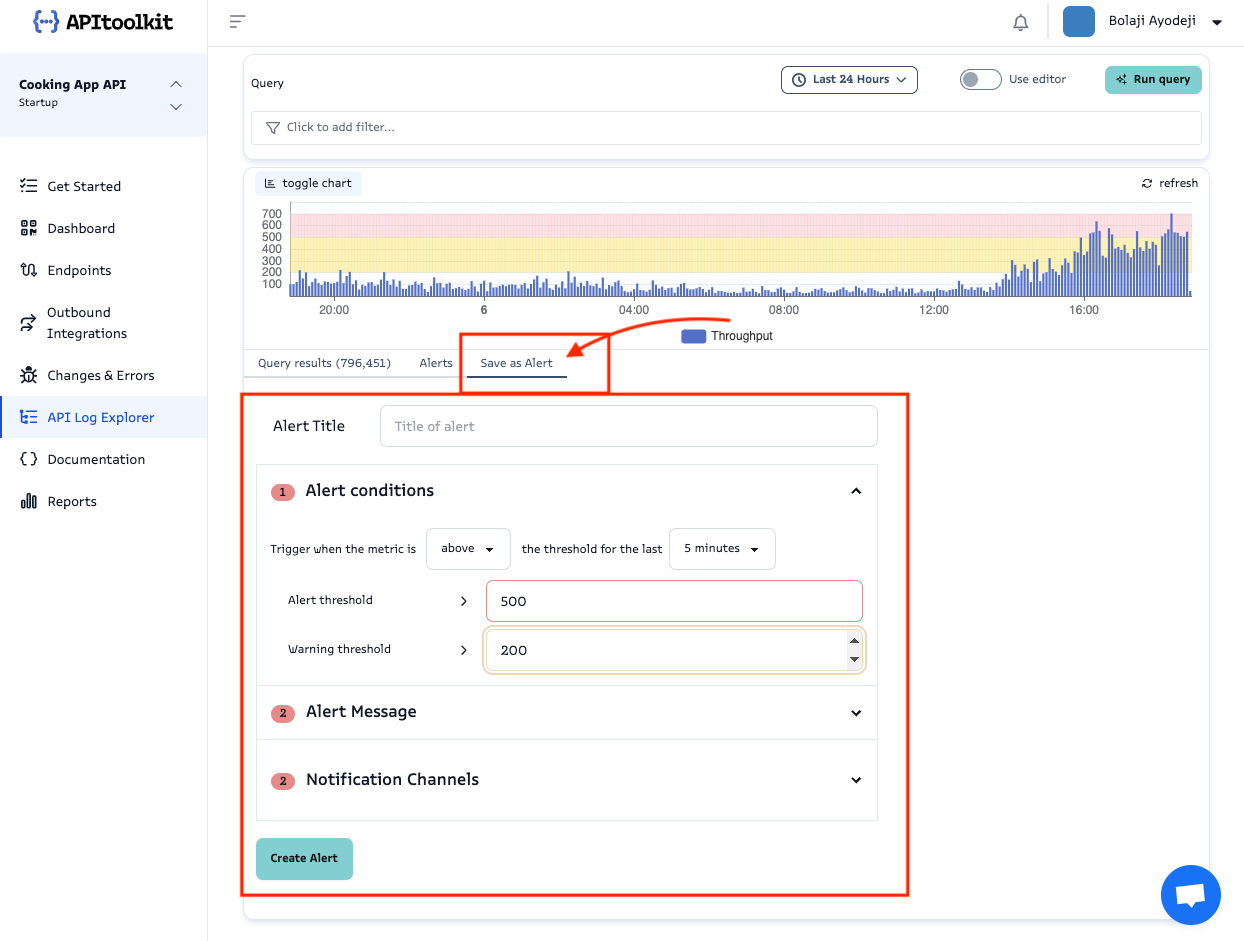
A threshold level is the the value that must be exceeded for a certain reaction to occur or be triggered.
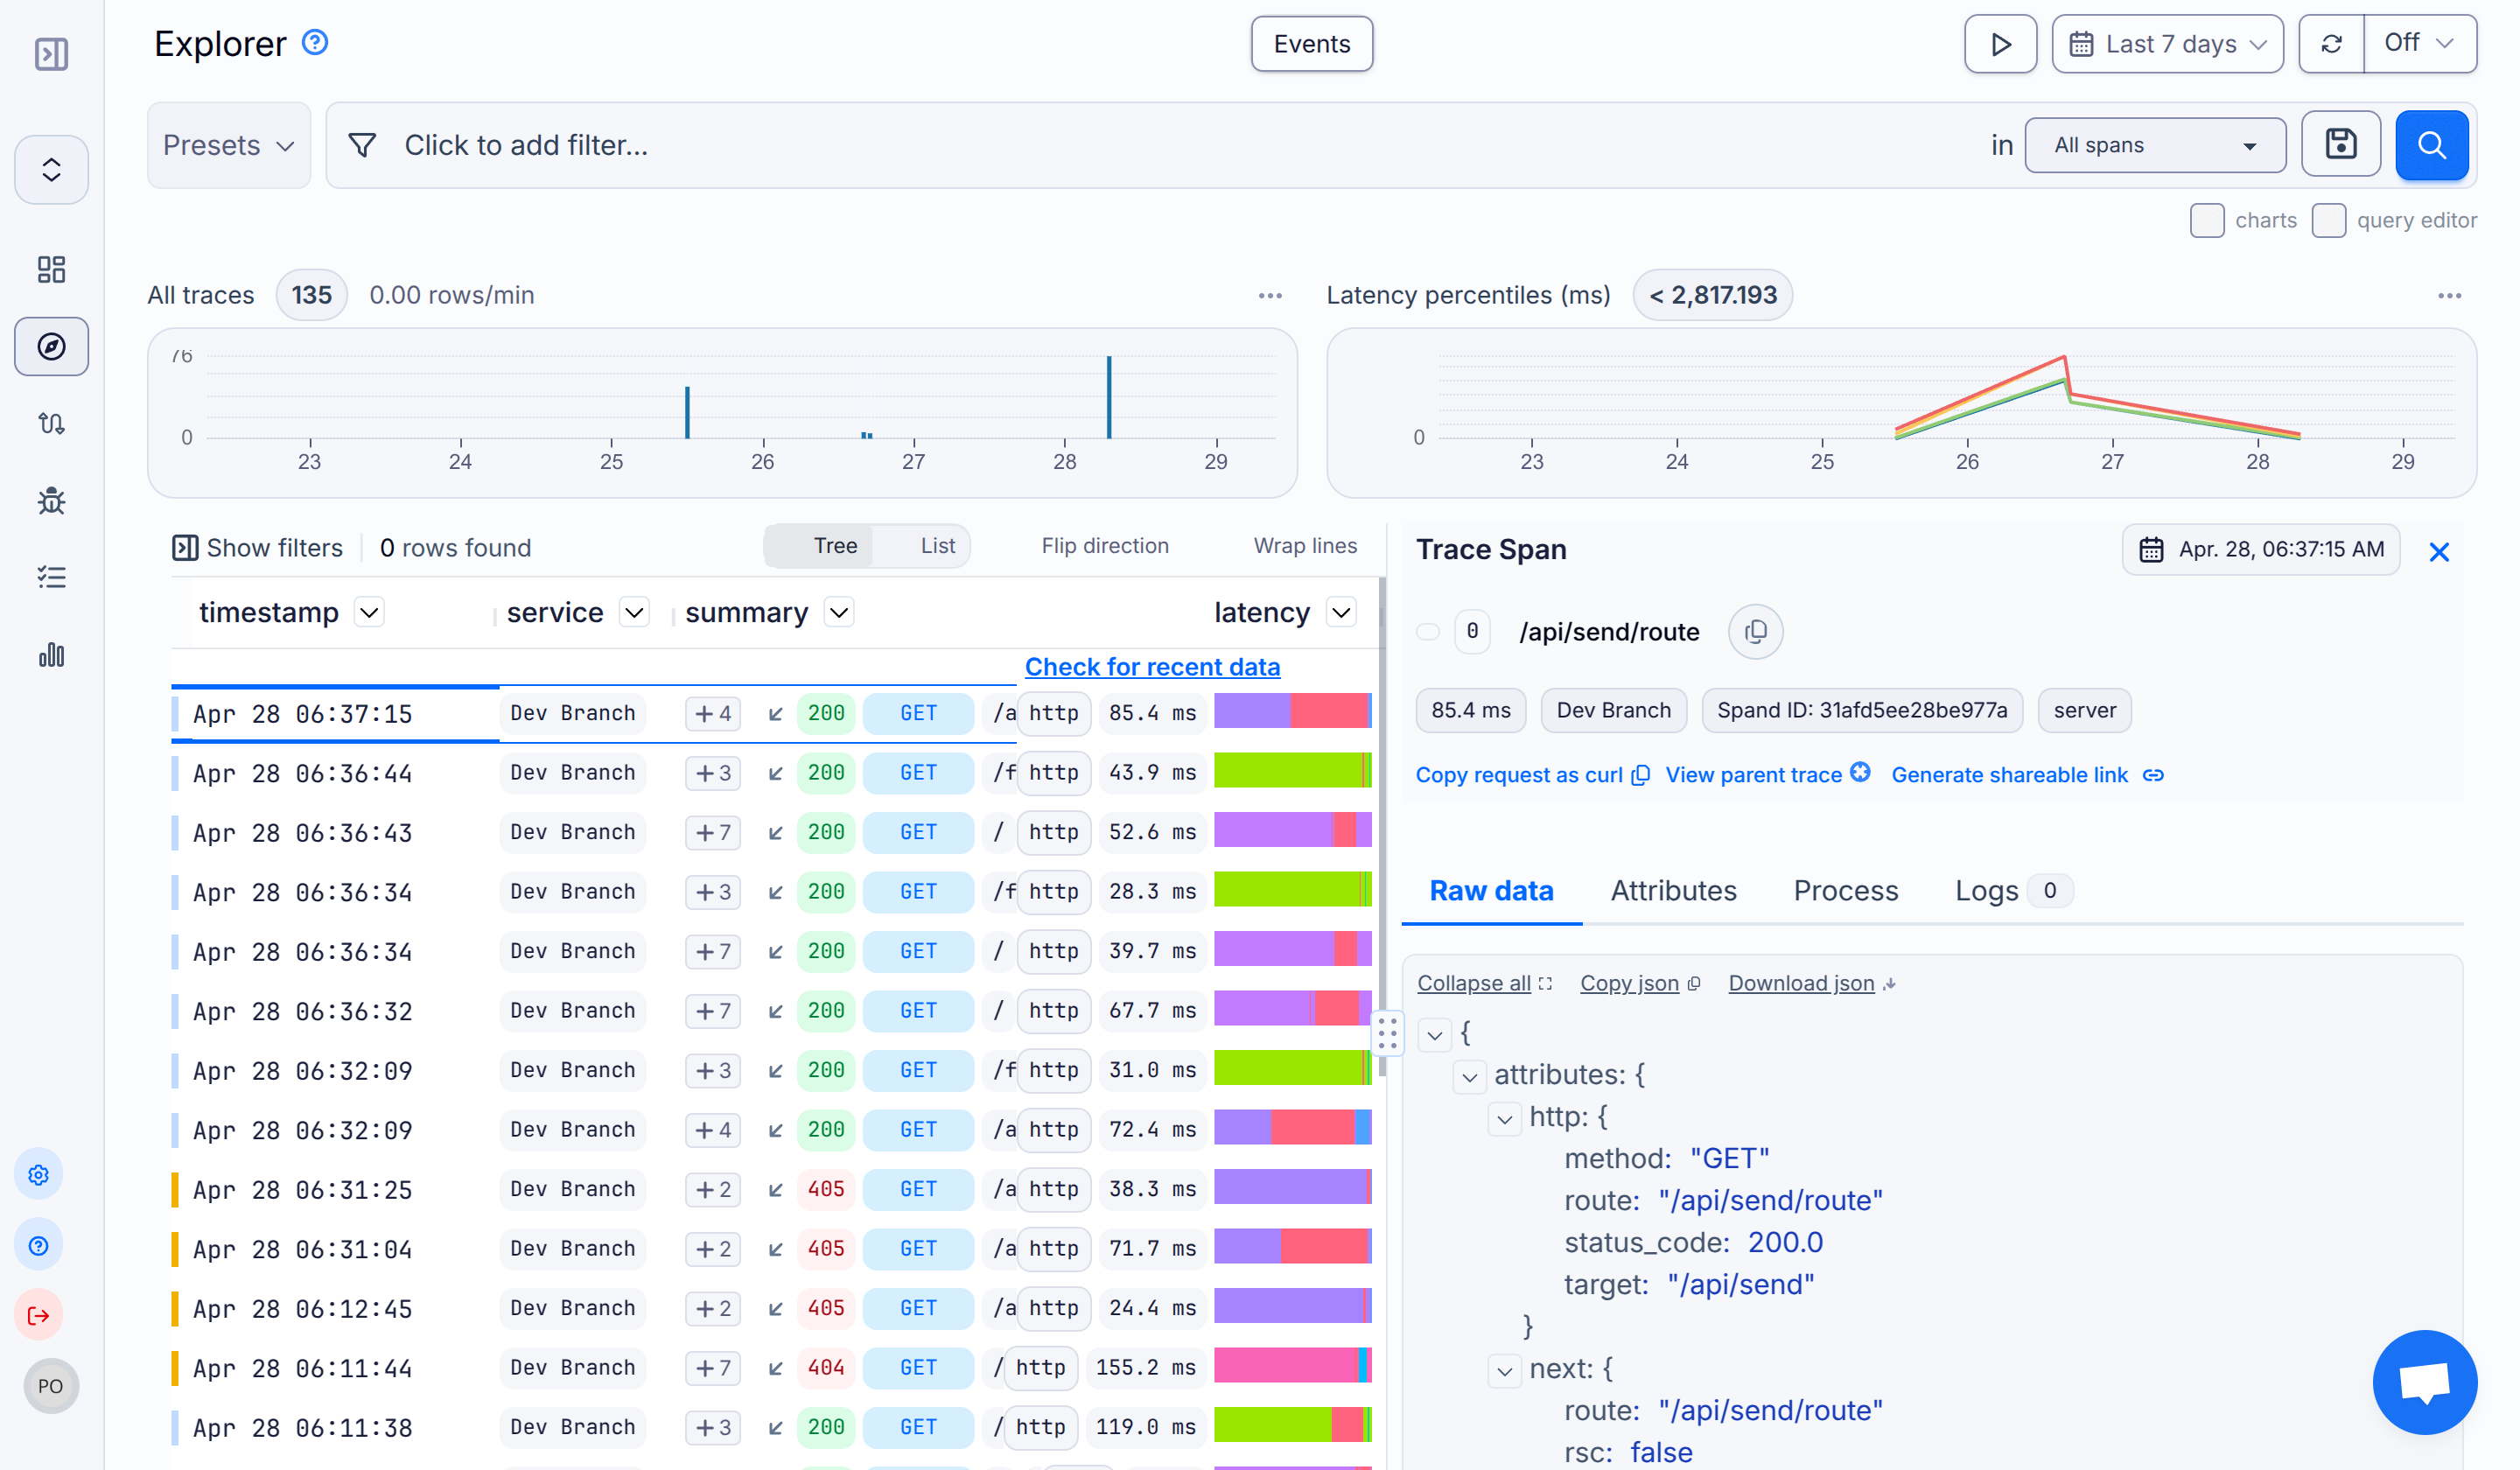
Share URL
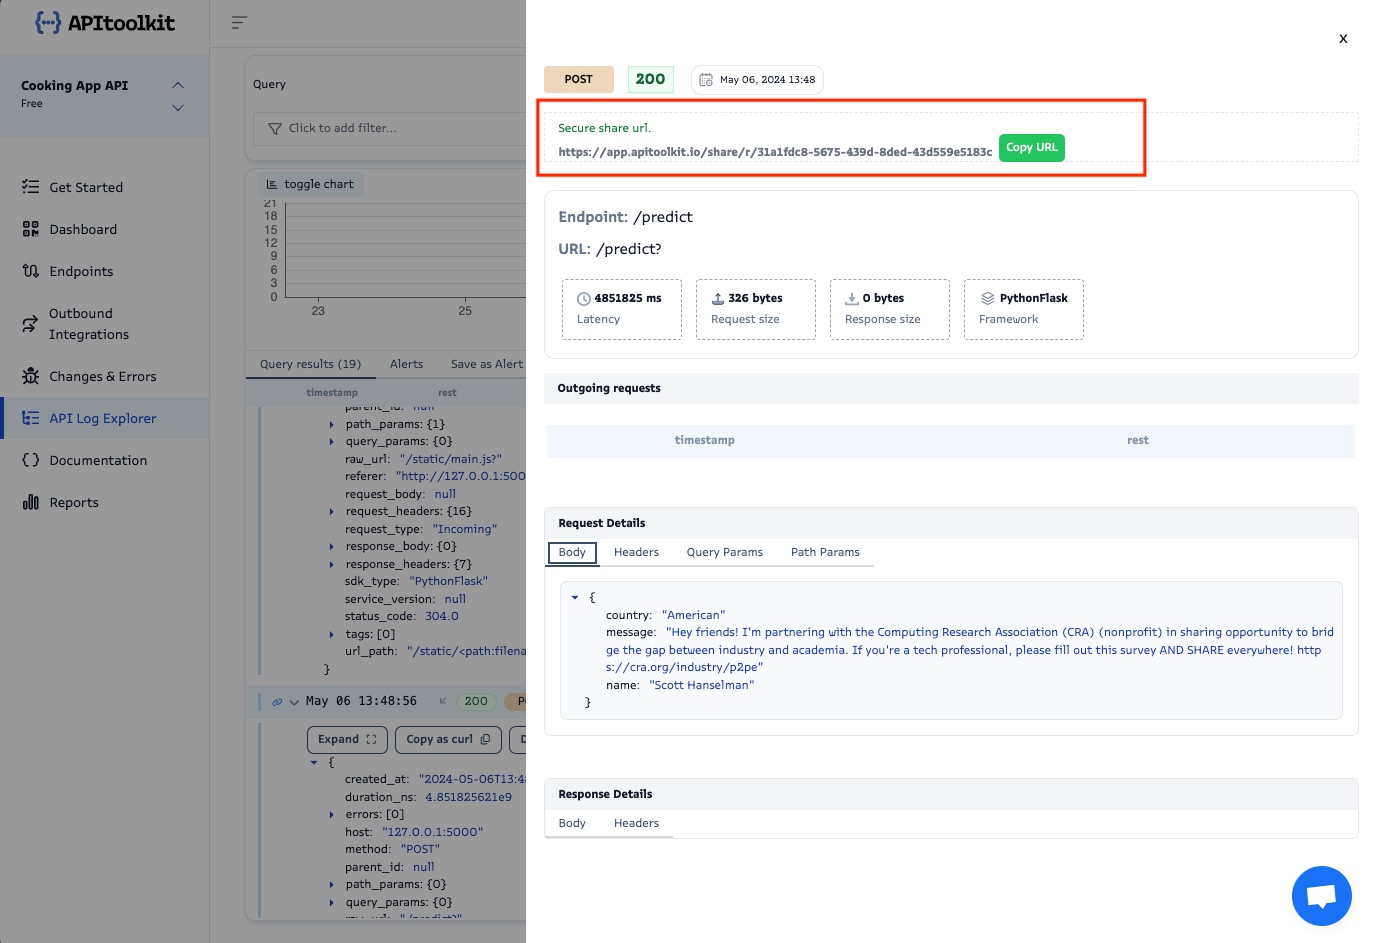
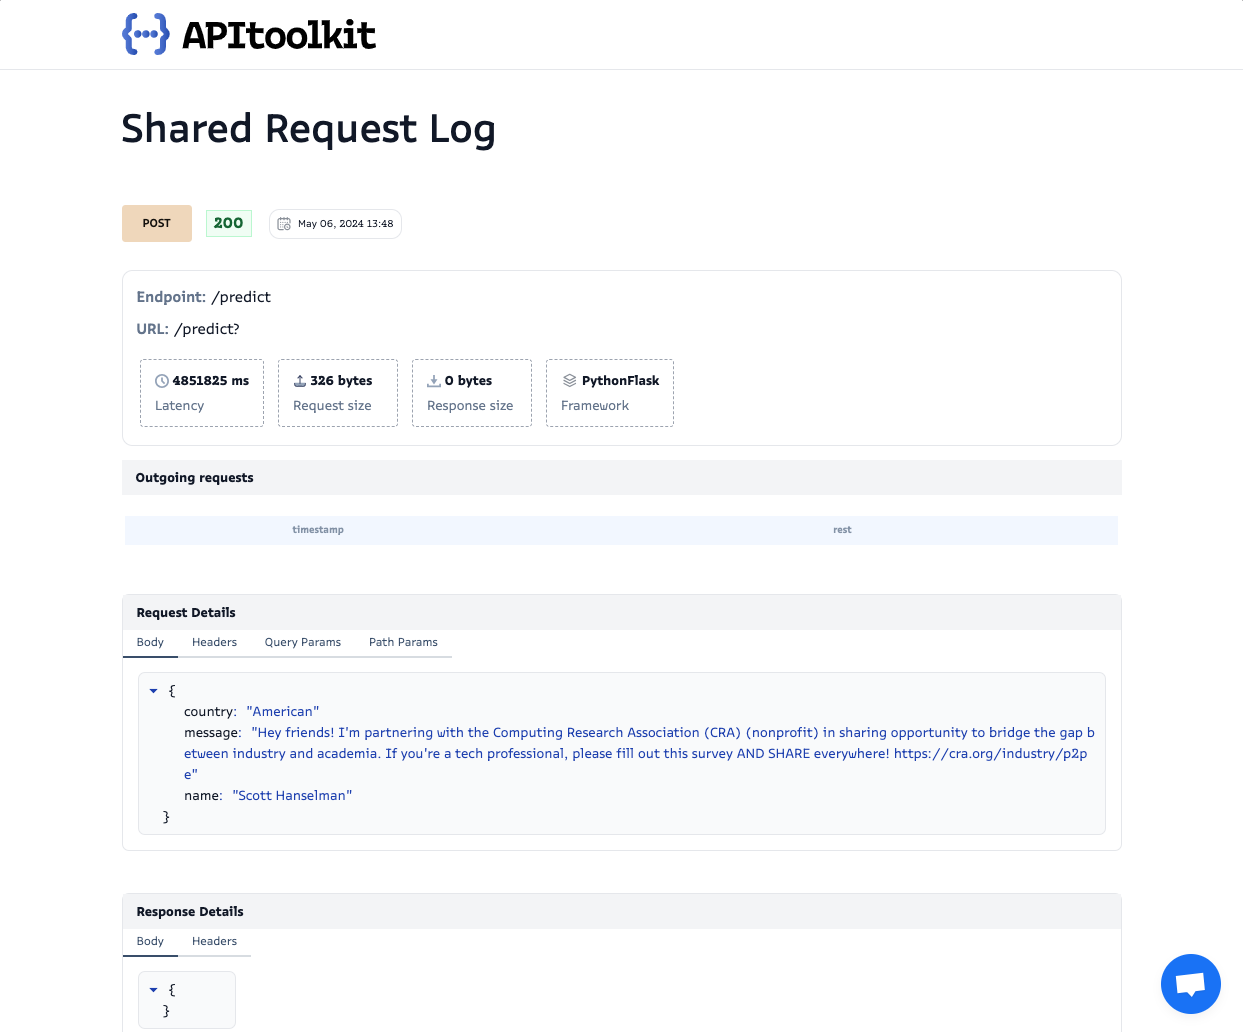
APItoolkit allows you to publicly share the details of a particular log request to anyone you desire (maybe someone on the customer support team). All you need to do is click on the request, expand it, select the expiry date of the link, and click the Get link button. This will create a secure link which you can share with anyone.
Here’s a quick video overview for a visual walkthrough of this page:
Next: Changes & Error Page